Open the attached file, scroll down to page 2, and view the cone displacement graph. Notice that cone movement decreases as the frequency approaches the port tuning frequency (Fb), which is 47hz. Basically as the driver begins to cut off, the port starts producing sound.
As the frequency goes lower below Fb, the cone displacement increases quite fast. But if you look at the amplitude response graphs on page 1, you see that the output of the system is dropping really fast as well. So when you put a lot of energy into the driver below the port cutoff, the energy is wasted and the excessive cone movement degrades how well the driver can produce sound at higher frequencies. I believe it's fairly common to place the HPF no lower the the system's F6 (F6 is the -6dB point). I believe in this tuning, F6 is somewhere around 40hz. Note in the cone displacement graph, the driver reaches Xmax with 125W at about 40hz.
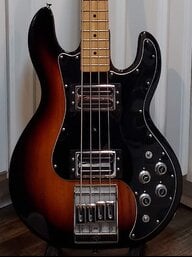
You can run the HPF higher if you like as well. I believe the driver output is more controlled and well damped than the port output. Keep in mind the electric bass does not produce a very strong fundamental frequency, so there is not really a lot of musical information in that frequency range to begin with. Most of what we perceive as fat is above 60hz.
Regarding the distribution of energy in the bass guitar's output, you may find this thread illuminating:
Bass frequency/waterfall plots: what they mean to rigs
If you want to see what happens with a sealed cab, take a look at the second tuning in the attached document that starts on page 3.