• TalkBass has been independent since 1998. Add your voice.
    Create a free account to reply to discussions, view embedded media, and browse with fewer display ads.
    Join freeLog in
    Want zero display ads or expanded classifieds tools? Compare plans.

Help with WinISD Results for a Sealed 210 Cabinet

I’ve never attempted this before, but I’m going to be building a simple sealed 210 cabinet for home practice and I’ve modeled a few different drivers using WinISD. Sorry for the long post, but I have some questions about understanding how the WinISD results will translate into what the cabinet sounds like. I’ve attached the Transfer Function Magnitude graphs for six different drivers along with some measured values from these graphs.
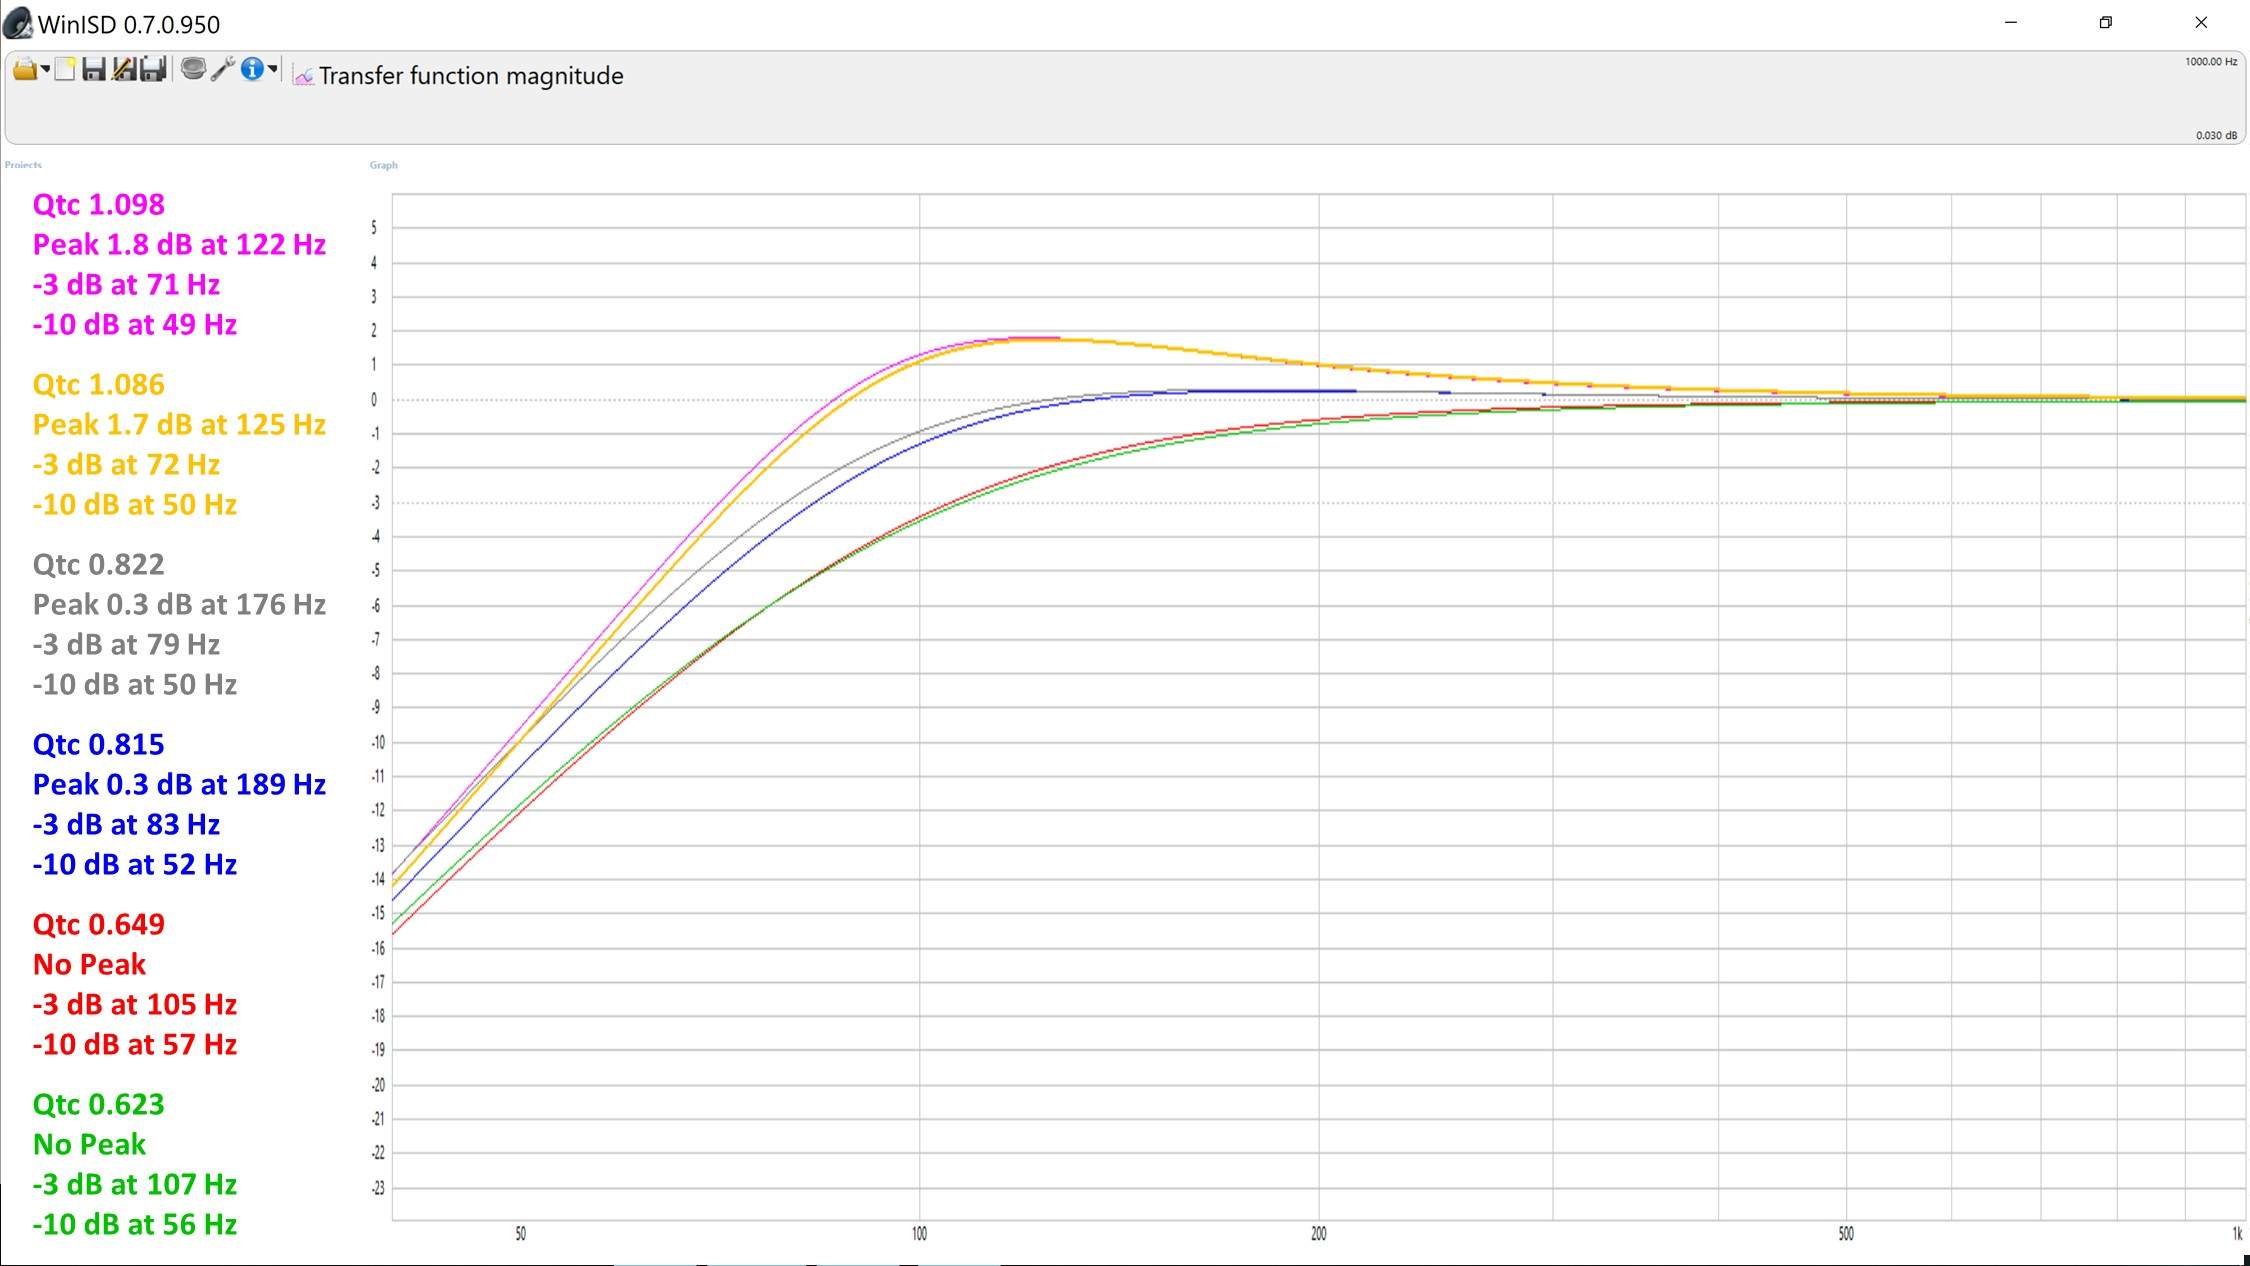
Transfer Function Magnitude.jpg


The drivers appear to fall into distinct “groups” depending on the Qtc value. The two drivers with the highest Qtc values (around 1.1) seem to have much stronger bass response and a noticeable peak around 124 Hz. The two drivers with the lowest Qtc values (around 0.6) seem to have the weakest bass response and no peak at all. And the two drivers in the middle with Qtc values around 0.8 have bass response somewhere between the other two groups and very slight peaks around 180 Hz. Is this an accurate interpretation of what I’m seeing in these graphs? Will designs with higher Qtc values generally result in stronger bass response? Are there any tonal disadvantages to a stronger bass response as long as the driver’s Xmax is not exceeded?

I don’t need a lot of power handling and don’t need to extract every last decibel of loudness, in fact a quieter cabinet could allow me to use more of the amp’s volume control. I would like something with clear, solid bass, but not boomy or muddy. In general, I tend to favour a stronger midrange over a very low bass and I often play with a slightly overdriven tone.

It’s entirely possible that I’m overthinking all of this since the amp’s EQ controls will be able to adjust through a greater range than the 4 to 5 dB differences between these drivers, but I’d really appreciate any input you can offer as to how to interpret the WinISD results and any things I should be looking out for when comparing various drivers for this project.

 
Modeling at 3CF (85L) for the two higher Qtc curves shifted the -3dB frequencies down to about 67Hz, the -10dB frequency to 45Hz and the peaks went down to 1.3dB and 1.2dB at around 120Hz. In other words an overall shift of about 4 to 5 Hz lower with about 0.5 dB less peak. The Qtc values dropped to 1.01 and 0.99.
 
With those 2 drivers, they perform better in a larger box. If you wrntveven larger, you might end up with even better performance but the size begins to impact practically.

What do you have selected in the model for box lining (or stuffing). Increasing this in the model may also improve the peaking (though at 1dB it's not an issue)
 
I didn't realize I could model lining or stuffing in WinISD. I just did a little further reading and found that this is the Qa parameter in the Advanced settings. What are some typical values for various amounts of lining or stuffing?

Is there a point at which the stronger low end response would become boomy or muddy? I do want to keep this cabinet on the smaller side and I don't know that going as high as 3CF is practical in my case.

Is there something about the other four drivers with lower Qtc that is less desirable than the two with higher Qtc?
 
EVERYTHING is a tradeoffs.

When a driver tubes well in a smaller box, you may give up some low end extension but you don't (or may not) end up with the lie mid hump either.

I don't use that software, you will need to research how that parameter models.
 
Thank you very much for all of your input.

I noticed that as I change the Qa (absorption) parameter, the Qtc value updates as well. So I changed the Qa value until the Qtc value matched that of one of the other drivers and the response graph became nearly identical to that of the other driver. In other words, the stronger bass response became weaker and the peak reduced to match that of the other driver when the Qtc values were the same.

I'll do some more reading about appropriate values and play around with it a little more.

Final question ... for now ... are there particular Qtc values to target or avoid in order to produce particular tonal characteristics (either good or bad)?
 
Drivers with lower Q's are typically designed to work well in ported enclosures. As you're after a sealed box, a driver with a higher Q (and typically less efficiency) is appropriate. An SVT fridge box is loaded with rather low efficiency drivers - it gets its efficiency through mutual coupling of a lot of them. Using just 2, you can get OK response, but it won't be all that efficient. As a home practice cabinet, probably not an issue, just be aware it may not work well when you need more output.

I agree that you should look at a higher cabinet volume - see if you can get some more low end extension. 10 dB down at 50 Hz means the low notes on your E string won't have much authority. Having a peak in the passband (the humps at a bit above 100Hz) is something you may or may not like - I personally get tired of anything with much of a hump down there pretty quickly - I'd gladly give that up to get some more low frequency extension.

Your mileage may vary. Enjoy the journey.
 
  • Like
Reactions: agedhorse
I've revised the cabinet volume to the largest I can practically get away with (about 2.7CF) and it does make for a nicer low end response. As I need the cabinet to be 8 ohms, my driver choices are limited to either 4 ohm or 16 ohm. I've found a few that result in stronger modeled low end response without the peaking around 120Hz, but usually at the expense of either power handling or SPL (these may not be of great concern since I won't be gigging this cabinet).

Some of these other drivers are intended as hifi or home theater speakers and have broader frequency response curves than the typical bass guitar drivers ... which leads me to another question. Can differences in drivers' frequency response graphs compensate for (or exaggerate) differences in their transfer function magnitude graphs? Say we're comparing two drivers and one driver's frequency response is 5dB higher at 40Hz than the other's, but the second driver's modeled transfer function is 5dB higher at 40Hz than the first. Assuming (dangerous!) that the published frequency response graphs for each driver was generated and measured the same way, is it fair to say that these two speaker cabinets would produce the same output at this frequency?
 
First of all, I think you will find 16 ohm drivers (as a generalality) to sacrifice less in sensitivity (per watt) than the 4 ohm variant of the "same" driver.

Second, when looking at drivers, focusing on only the low end response means that you will be missing all of the other important parameters that are necessary to make a good bass guitar speaker system. Specifically, things like mid voicing, mechanical power handling, sensitivity, harmonic character, etc.

Hi-fi and home theater are usually a horrible choice IME
 
I suspected that would be the case with hi-fi and home theater speakers. Creating music versus reproducing sound being very different things.

Considering other elements of the speaker's tone (mid and treble range response) is what led me to wonder whether the speaker system's response is essentially the sum of the driver's frequency response and the modeled transfer function magnitude. Can the transfer function magnitude be added to (or subtracted from) the driver's frequency response to arrive at an overall system response for comparing various options?
 
FWlittleIW when I built a ported 1x10 cab that modelled in winisd with a peak like your mauve/yellow it came out rather boomy. Sealed the ports which caused it to model more like the red/green and the end sound was much better. But of course that's just one example, be foolish to extrapolate that across the board.
 
There are 2 distinct models involved, the <250Hz model which is based on the TS parameters and the >250Hz model which is based on the measured driver response.

The measured response <250Hz will not be accurate because it does not include parameters that affect the speaker in the encosure.
 
  • Like
Reactions: BasturdBlaster
Wow, I've got to thank you all again for your input.

@JimChjones great to hear your first-hand experience in comparing the modeled graphs to the real-world tonal character. Your caution about making generalizations is understood and appreciated.

@agedhorse is it reasonable to add the modeled transfer function magnitude to the measured driver response for the <250Hz region while simply using the measured driver response in the >250Hz region in order to determine a system response for the purpose of comparing various driver/cabinet combinations?
 
Yes, the graphs can be spliced, but care is necessary to insure that the levels match at the splice point. There can be discontinuities at the splice point due to different boundary spaces, sensitivity standards, measurement artifacts, etc.