• TalkBass has been independent since 1998. Add your voice.
    Create a free account to reply to discussions, view embedded media, and browse with fewer display ads.
    Join freeLog in
    Want zero display ads or expanded classifieds tools? Compare plans.

Thread Count: TB Classifieds

Here you go :)

Today our anti-bot honeypot blocked 269 registration attempts from spam bots.
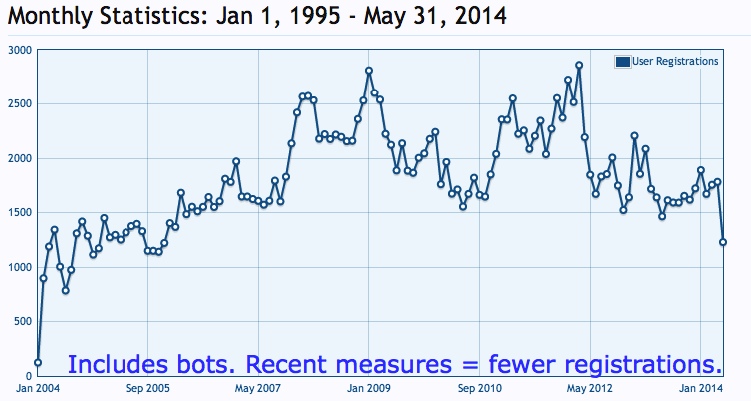
Screenshot at Jun 16 18-04-47.png
 
  • Like
Reactions: bassRunner
This is really cool! The observation about the 2009 downturn is interesting, too. It would be great to compare the TB classified trends vs. retail musical instrument sales in the U.S. during the same time frame. I think the variance you will see in retail sales is much more than on here.
 
Here you go :)

Wow, thanks so much, Paul! Would you mind passing along the tabulated data? I'd love to get my hands dirty.

@Gravedigger Dav, it sounds like you are interested in having determine whether the differences in monthly sales per month are significant. I can totally come up with error estimates for the plot in post #6, but it will take a little bit of work. As I mentioned before, I'll need to perform a statistical technique called bootstrapping, which basically means you take random realizations of your data set so you can estimate errors. This eliminates the need to renormalize accounting for the change in number of talkbass members since it's already baked into the data from which I'm sampling. I don't mean to get too technical here, but if you really do want to determine if there are better and worse months to post your basses for sale, I'm happy to work on that for you.

I'm interested to see the membership data because it could explain the overall trend of the plots in posts #1 and #13, but this is a separate issue from the error estimates for post #6.

Thanks everyone for participating in my nerdery!
bR
 
Wow, thanks so much, Paul! Would you mind passing along the tabulated data? I'd love to get my hands dirty.

@Gravedigger Dav, it sounds like you are interested in having determine whether the differences in monthly sales per month are significant. I can totally come up with error estimates for the plot in post #6, but it will take a little bit of work. As I mentioned before, I'll need to perform a statistical technique called bootstrapping, which basically means you take random realizations of your data set so you can estimate errors. This eliminates the need to renormalize accounting for the change in number of talkbass members since it's already baked into the data from which I'm sampling. I don't mean to get too technical here, but if you really do want to determine if there are better and worse months to post your basses for sale, I'm happy to work on that for you.

I'm interested to see the membership data because it could explain the overall trend of the plots in posts #1 and #13, but this is a separate issue from the error estimates for post #6.

Thanks everyone for participating in my nerdery!
bR
I wasn't requesting any action on your part. Being a database analyst, it sort of is reflex action when data and data statistics are discussed. Just interested in your methods and techniques. What you are doing is retail sales analysis and I have done a bit of that in my career in IT.
 
  • Like
Reactions: bassRunner
I wasn't requesting any action on your part. Being a database analyst, it sort of is reflex action when data and data statistics are discussed. Just interested in your methods and techniques. What you are doing is retail sales analysis and I have done a bit of that in my career in IT.

I see. Honestly, I was trying to gauge the context of your posts, and now I understand, you're a pro at this kind of thing! Thanks for chiming in, and I appreciate your suggestions since you are way more familiar with industry standard techniques than I am.

Since I've gotten your perspective, let me give you mine. I'm a graduate student in astrophysics, but I'm interested in making a move to data science over the next year when I expect to graduate. The techniques I'm able to apply to the TB data are ones I've learned and incorporated in my scientific research, but I know this is not the be all end all as far as this type of analysis. Input from pros like you is exactly what I'm looking for.

This thread, as well as the other one I started (Price Distribution: TB Classified), is meant to be a resume builder for me. I've already learned a lot, for example about the bot issue with membership data, and the more I can learn the better.

Seriously, thank you!
 
I see. Honestly, I was trying to gauge the context of your posts, and now I understand, you're a pro at this kind of thing! Thanks for chiming in, and I appreciate your suggestions since you are way more familiar with industry standard techniques than I am.

Since I've gotten your perspective, let me give you mine. I'm a graduate student in astrophysics, but I'm interested in making a move to data science over the next year when I expect to graduate. The techniques I'm able to apply to the TB data are ones I've learned and incorporated in my scientific research, but I know this is not the be all end all as far as this type of analysis. Input from pros like you is exactly what I'm looking for.

This thread, as well as the other one I started (Price Distribution: TB Classified), is meant to be a resume builder for me. I've already learned a lot, for example about the bot issue with membership data, and the more I can learn the better.

Seriously, thank you!
Best of luck to you. Your formal training is way ahead of mine. My knowledge has come through practical experience.
The basic concept for determining sales volume by month is number of units per month and expressed as a percentage. For example:

Months Jan Feb Mar Total
Units sold 3 8 6 18
Percentage .168 .444 .333 (units sold this month / total units sold for the year)

Indicates more units are sold in February than any other month

Over time, you would use the sums for each month over a period of years to get a more accurate results.
 
  • Like
Reactions: bassRunner
I think I see what you're saying. I was gonna work a little more on this data tonight. I'll remake the plot in post #6 using your method, which seems like it should eliminate the effect that 2006 has way fewer threads than 2010 because values will be expressed as percentage per year. I'll post later.

 
I think I see what you're saying. I was gonna work a little more on this data tonight. I'll remake the plot in post #6 using your method, which seems like it should eliminate the effect that 2006 has way fewer threads than 2010 because values will be expressed as percentage per year. I'll post later.


It would be valuable to know why 2006 had fewer threads. This would still skew the results because you sum all the Januarys together, and so on for each month. You need to do this so you can know the total units sold.
But, you can reduce that issue if you do each year separately then average the percentages.
 
Regarding the bot problem: If you could adjust the number of new registrations by the number of accounts banned in the next 10 days or so, that might give you a good idea of how many real accounts were created. My hypothesis is that the number of banned accounts belonging to real people is a very small percentage of the population of Talkbass.
 
I've incorporated @Gravedigger Dav's suggestion and was able to make error estimates by normalizing the data from each year by the number of total posts in that year. As I thought, there isn't a significantly better month to start your sale thread. This data suggests it is not worth delaying your sale waiting for a month when not as many sale threads are started in hopes of fetching a higher price.

monthly_percentage_bass_guitars.png
 
  • Like
Reactions: Gravedigger Dav
As a business owner and manager, the sales stats would be the only ones which spoke to me.
Listings vs sales vs amount of time between Listings to the time the product sold- number of products which NEVER sold (12 months is a pretty good benchmark for this), percentage of price reductions til product sold.
These are all useful metrics.
 
  • Like
Reactions: bassRunner
@nukes_da_bass, so far this thread has been focussed on supply, but it sounds like you'd be much more interested in the demand. I think there is something relatively simple (although with several caveats) I can do. I'll remake the plot in post #30 but for the data on when the "sales" were made.

Here's how I'll define a sale. First, the thread must be closed/locked. Then I'll define the date of the sale as that of the final post to the thread. The caveats here are this will include threads where the seller has closed the thread for other reasons, e.g. decided to keep the bass, sold through craigslist, etc. But this will be a simple way to address the question of demand.

With the new site upgrade, filtering the threads that actually sold is easier because the link says in red "SOLD." But this will only apply to the last 2 months worth of threads, so I'll proceed with my loose definition of a sale for the sake of statistics.
 
We need to hire you a stable of research assistants who can read and code content of the threads (using multiple coders for each, of course, to enhance reliability of measurement). There are a lot of interesting hypotheses you could test if you had data on thread content, such as reasons given for selling, amount by which asking prices had to be reduced, etc.
 
@nukes_da_bass, sorry it took so long for me to get around to this. In my last post, I mentioned how I'd have to define a "sale." I've implemented this definition into my data collection code, and below are the results. The second plot indicates January is a pretty poor month to try and sell a bass. Not surprising since a lot of folks may be recovering from holiday spending.

sales_count_bass_guitars.png
monthly_percentage_bass_guitars_sales.png
 
I was thinking this would be more obvious in the data as well, Chuck. I wonder if the effect was delayed by a couple of years, when the linear trend flattens. Or perhaps there was a balancing effect between people who decided "better not sell any basses because now I can't afford any new ones" and people who decided "better sell lots of basses to fund other aspects of my life."

The first hypothesis could be negated if we determine that the number of sales threads corresponds to the number of users on the site. I actually have come up with a systematic way to collect data about how many users were registered each month, the trouble is this will take over a day of computer time to collect. Basically, I'll need to write a program to sift through the approximately 250,000 users pages and record there join dates. Running this on a small subset of users and scaling, I estimated this program would take 30 hours to run.

Thanks for reviving the thread :) When I get a chance, I'll start looking into the user data.