
Hey all. Here's my second project in analyzing some of the data in the talk bass classifieds. You can find my first project here: http://www.talkbass.com/threads/price-distribution-tb-classifieds.1074921/
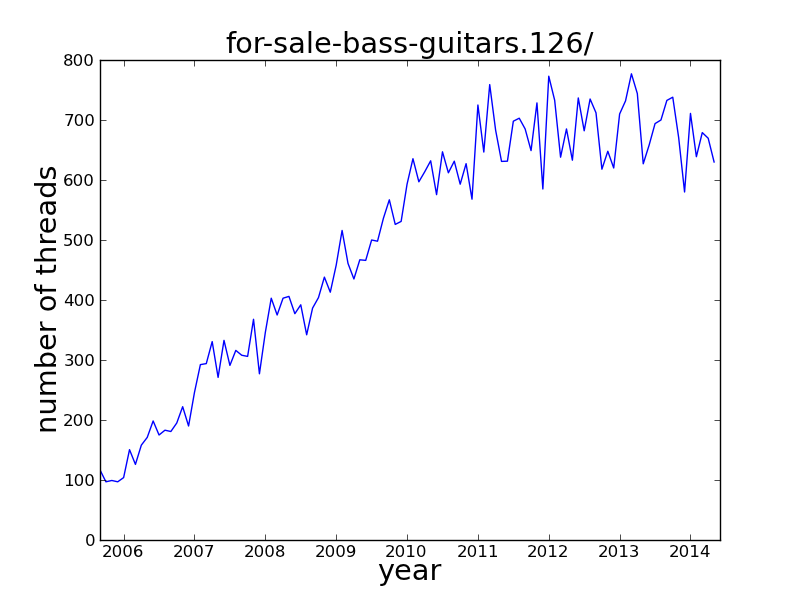
Anyway, what I've done here is simply count the number of threads started each month in the for-sale-bass-guitar forum. It looks like September 2005 was the first month with more than a couple of threads. Do tb veterans remember when the classified forum went live?
Honestly, I had higher hopes for this data. Of course there are several other forums (amps, effects, parts, etc.) to search that may be better for teasing out the information I was hoping to find. Mainly, I was hoping to be able to identify (by eye) seasonal variations. I was thinking that November and December would be months with high thread counts as people tend to have lots of expenses around the holiday season. I also thought tax season might make itself obvious. We can see some clear ups and downs from month, but nothing jumps out at me saying "holiday season."
I was also thinking the economic downturn in 2008 would be pretty obvious, but it looks like there is a more or less linear increase in threads per month beginning in 2005 (well before the downturn) that extends to about 2010, after which things level off.
Just a note: I have accounted for the difference in number of days in each month. All things equal, March will naturally have about 10% more threads started than February. I've removed this effect in my code.
I'll run my data collection code on the other classified forums and post later. For now, enough from me, here's the data! Any ideas?
Anyway, what I've done here is simply count the number of threads started each month in the for-sale-bass-guitar forum. It looks like September 2005 was the first month with more than a couple of threads. Do tb veterans remember when the classified forum went live?
Honestly, I had higher hopes for this data. Of course there are several other forums (amps, effects, parts, etc.) to search that may be better for teasing out the information I was hoping to find. Mainly, I was hoping to be able to identify (by eye) seasonal variations. I was thinking that November and December would be months with high thread counts as people tend to have lots of expenses around the holiday season. I also thought tax season might make itself obvious. We can see some clear ups and downs from month, but nothing jumps out at me saying "holiday season."
I was also thinking the economic downturn in 2008 would be pretty obvious, but it looks like there is a more or less linear increase in threads per month beginning in 2005 (well before the downturn) that extends to about 2010, after which things level off.
Just a note: I have accounted for the difference in number of days in each month. All things equal, March will naturally have about 10% more threads started than February. I've removed this effect in my code.
I'll run my data collection code on the other classified forums and post later. For now, enough from me, here's the data! Any ideas?






 Then, error bars with standard deviations. Oh wait, this is TB!!