• TalkBass has been independent since 1998. Add your voice.
    Create a free account to reply to discussions, view embedded media, and browse with fewer display ads.
    Join freeLog in
    Want zero display ads or expanded classifieds tools? Compare plans.

Class D Illustrated (lots of pics)

I always found it kind of funny when you would see a "3000 watt" amplifier, turn it around, and see a 495W draw listed on the power inlet (using the Crest Pro-Lite 3.0 as an example, at least by the pictures in the manual). Even besides that the inlet is an IEC C14 which is only rated to 10A draw (1200W @ 120VAC) and the average 15A wall receptacle it would be plugged into would only give you 1440W continuous draw until you popped the breaker after a few minutes (80% thermal trip rating), this all not yet accounting for the power factor of the device. Also, 3000W into a 2 Ohm load would be about 39A @ 77V going across your speaker cables. That would get toasty after a while on your average 16-12 ga. :)

Of course the point, I guess, is that we're not talking about "a while." I get the whole duty cycle and peak vs. average vs. RMS power thing (and the effect of what time window you're measuring those things), although one wonders exactly what size capacitors are sitting there on the supply rails to support all this. I'm also definitely not trying to bash; it's clear that a lot of great products out there do this. It's just that the huge disparities involved between what is probably a pretty reasonable listed average maximum draw on the back and what gets advertised on the front kind of makes me chuckle.

I have gone into detail about what the listed power consumption means and WHY it's stated in the way that it is. You might search on this, but in a nutshell, the standards for safety require that the listed power consumption be taken at a minimum of 1/8-power representing the peak to average ratio or crest factor in a typical music signal. If the intended application results in a greater duty cycle than that number may be used if it's greater than the 1/8-power number. The same 1/8-power audio signal is used for just about all testing including radiated and conducted emissions (EMC). It's that standard thatthe industry has used for years, and as power supplies & amps have become more efficient the consumption number had gone down which is why is more noticeable now than it was before.

There is nothing wrong with this method, there is no conspiracy, no evil intent, just an engineering standard around which product testing is built.

Besides, let's think about this a bit... take say an amp rated at 1000 watts "RMS" and drive a speaker with it. How many speakers on the market do you think are designed to play a signal with a crest factor of 1.414 (or 3dB... a sine wave) and would survive with that kind of power continuously without damage for more than a few seconds? the speakers are generally designed for a crest factor of around 9dB or 1/8-power. Very, very few. That's why the tests use this approach.
 
Last edited:
  • Like
Reactions: basscapes
I have gone into detail about what the listed power consumption means and WHY it's stated in the way that it is. You might search on this [...]

This? http://www.talkbass.com/threads/class-d-vs-class-a-or-a-b.922264/page-4#post-13293789

Thanks! An interesting read.

[...] the standards for safety require that the listed power consumption be taken at a minimum of 1/8-power representing the peak to average ratio or crest factor in a typical music signal. If the intended application results in a greater duty cycle than that number may be used if it's greater than the 1/8-power number. [...]

Ah, okay. I'm guessing that made it into one of the many UL standards as you had discussed in your referenced post. In any case I think we are on the same page technically regarding the differences between peak and average draw. Perhaps it is just more amusing to me because when I deal with power I usually deal with loads where the peak and average is almost the same. I do understand the difference though, and of course for amplifying an individual instrument such as the bass (rather than say a highly compressed wall of noise) the variations from peak to average or transient/attack to sustain will be dramatic (both in a dB logarithmic scale and then even moreso when translated into wattage). It was interesting to see the extent to which you had tried to quantify that for the bass in particular. I guess the takeaway is that the "peak wattage" that is used in advertising figures is really a number that is there to guide you on the amount of headroom for that you have over the average of the signal?

there is nothing wrong with this method, there is no conspiracy, no evil intent, just an engineering standard around which product testing is built.
No, of course. I was not implying that; my apologies if it seemed that way.
 
It really depends on what the manufacturer means by peak power. There are 2 commonly used definitions, one is the mathamatical peak value of a sine wave, that would be 2x the "RMS" rated power... BUT there is also an "RMS" power based on short bursts. For a FULL RANGE signal, it's common to use 20mSec bursts but for bass, as I have said many times, 20msec is a preposterous time period to use. It's not representative of anything in real world bass... it's one cycle at 50Hz or 2 cycles at 100Hz. I typically use something around 10X that time span when lookig at bass guitar dynamics and when developing dynamics management and processing circuitry and algorithems. If you are going to amplify bass, don't use design tools for say guitar.
 
Waking up this thread as it could stand to be the "Class-D" FAQ thread.

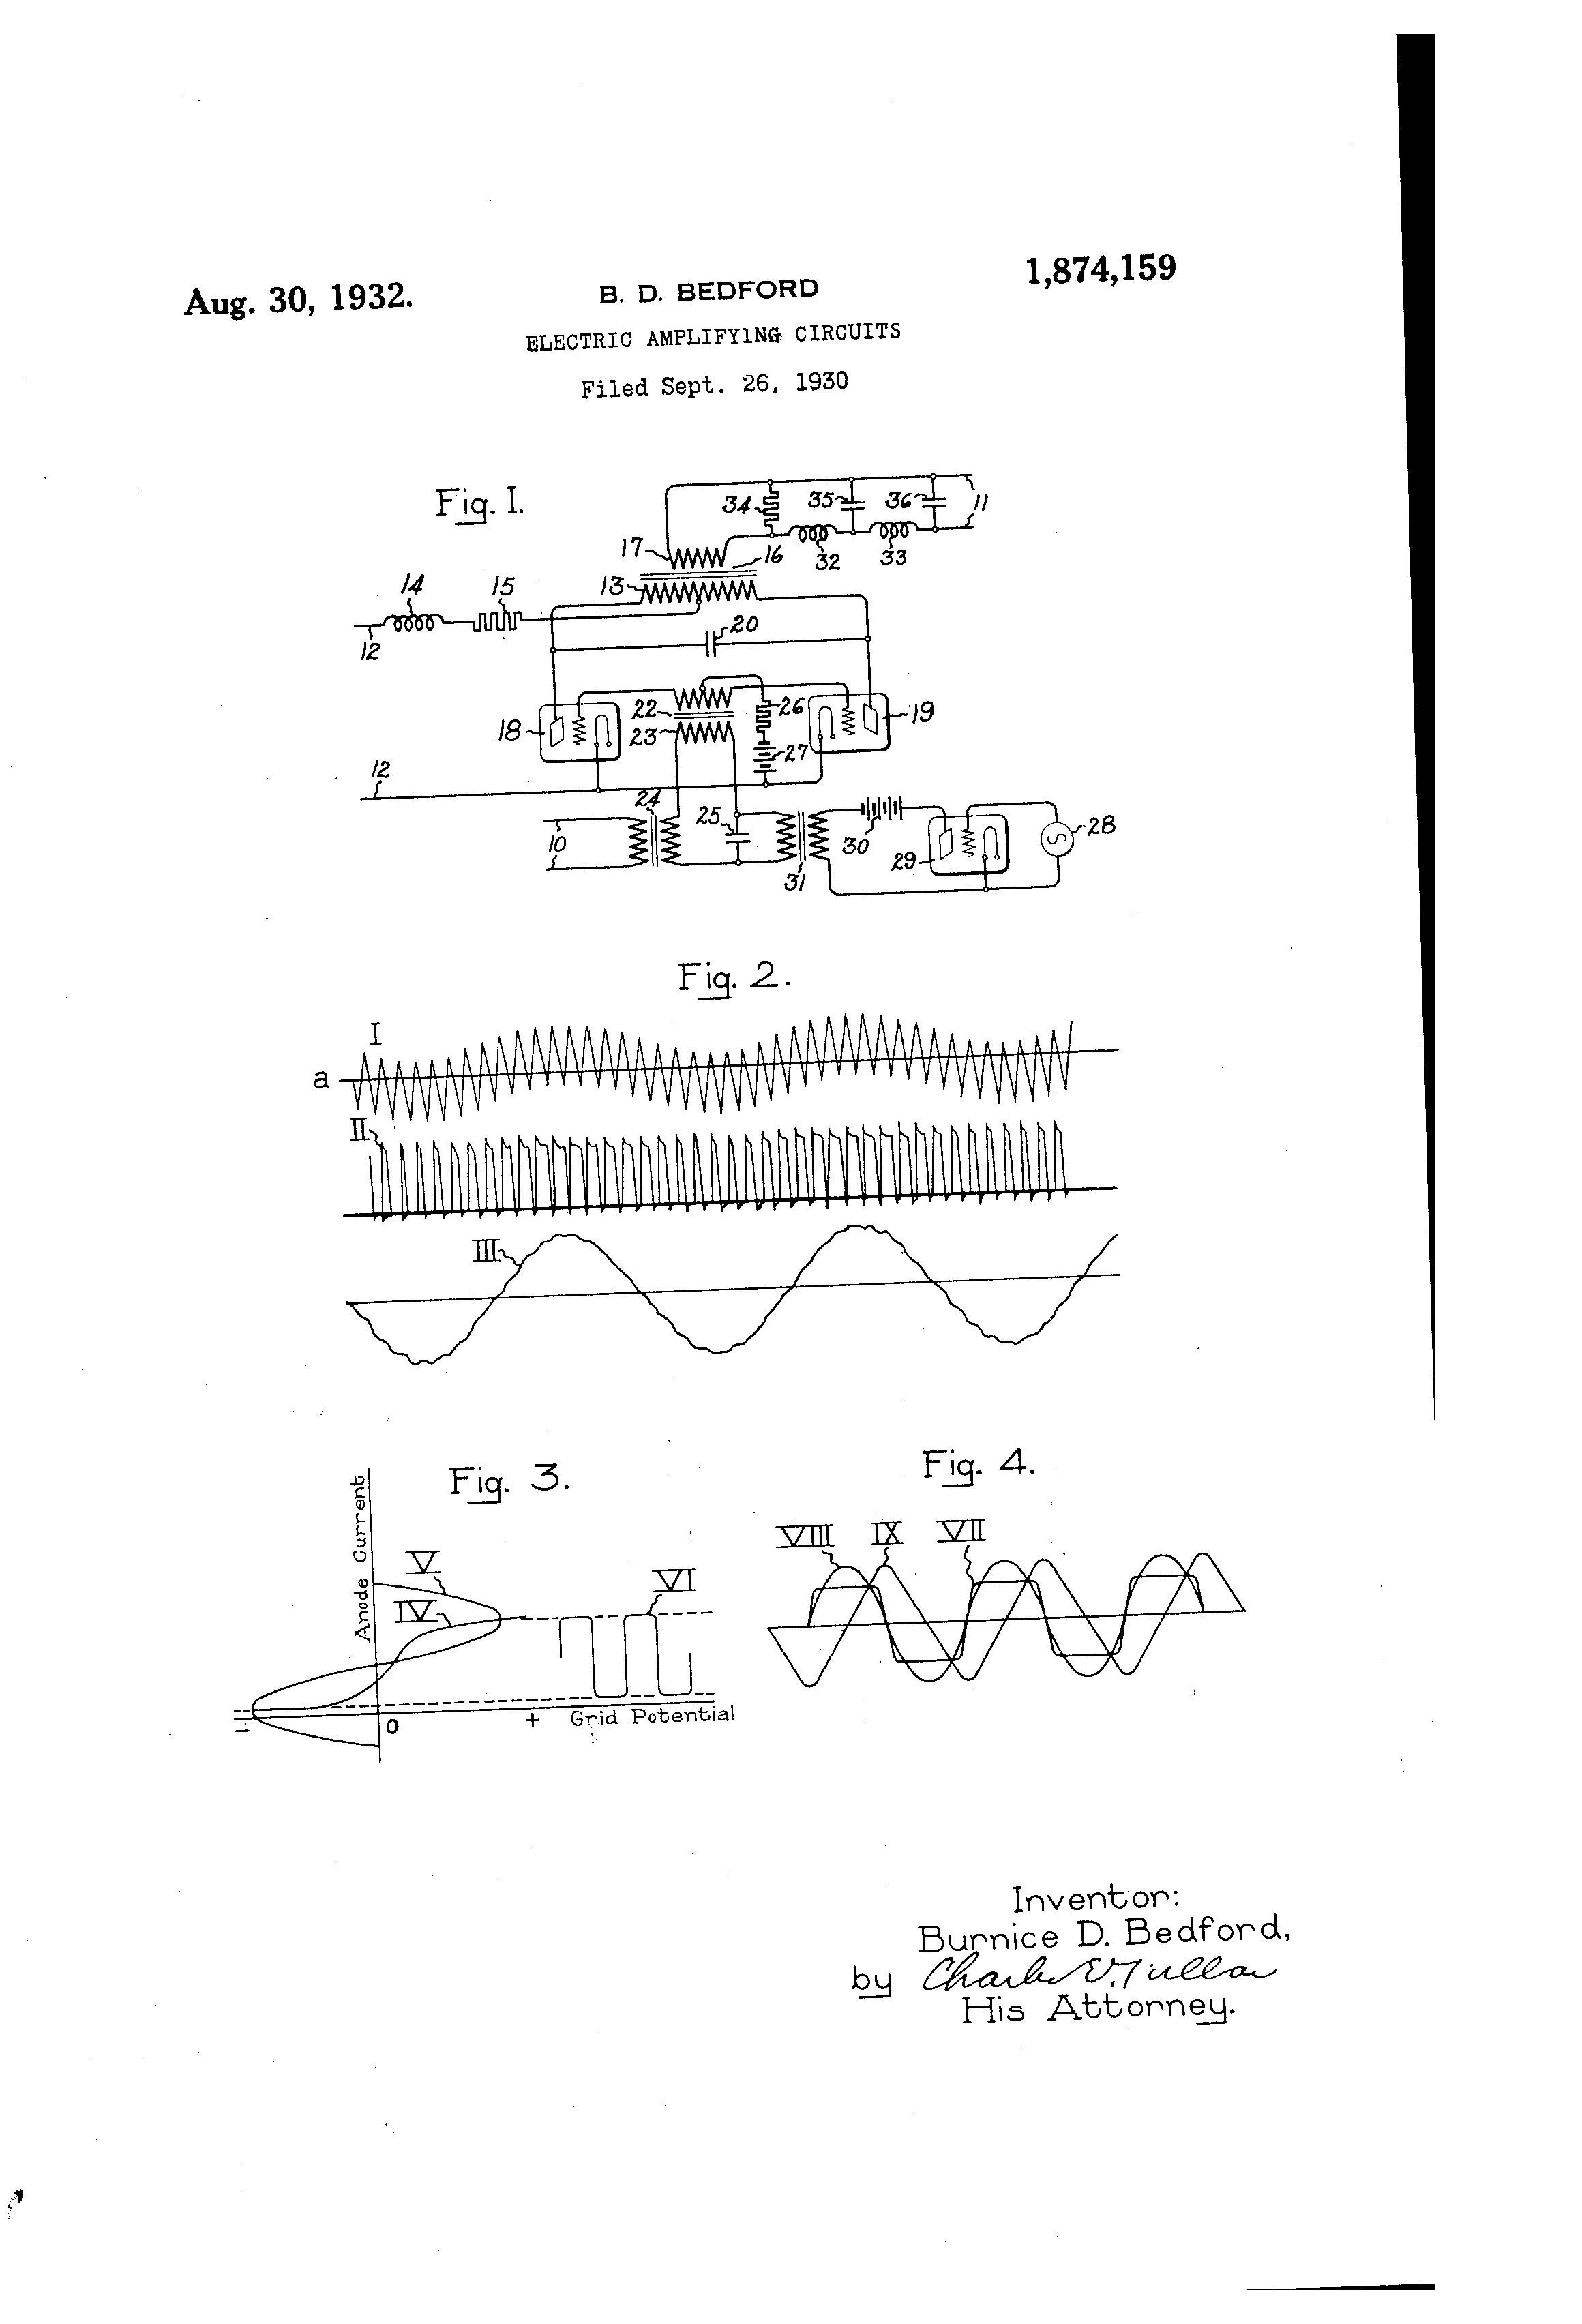
For the history of class-d here is an Image from the 1930's patent on a class-d (pwd) amp

US1874159-drawings-page-1.png


Rest of the patent is at:US1874159A - Electric amplifying circuits - Google Patents

Here's another 1959 Patent:
US3011025A - High power amplifier - Google Patents
 
I was inspired by the EQ discussion thread to run several basic class D simulations in SPICE to illustrate how it works.

Let's say you were playing a low G and you ran your bass into a preamp...if you looked at the signal for a brief slice of time, it'd probably look a lot like this: View attachment 431873
First, the class D amp will sample the audio. Sampling is done by comparing the audio to a triangle or sawtooth wave that is much higher in frequency. In this case, the sampling frequency is 400KHz, which is close to the frequency range of AM radio broadcasts in the USA. 400KHz has almost become an industry standard...more on that later. Anyway, in the next pic I'm going to overlay this audio wave on top of the saw. In comparison, the saw will just look like a blue bar. Notice that I've dropped a marker at a point on the audio wave:
View attachment 431874
This picture was just for reference. Now, I'm going to zoom in...

View attachment 431877

Now that we are zoomed in, the audio looks like a straight line and you can see the sawtooth wave. Each sawtooth is equivalent to a sampling period. As I mentioned above, the audio is compared to the sawtooth. This is accomplished with an electronic device called...a comparator. This changes our audio wave into a stream of pulses. Now, I'm going to add in the pulses to show how they line up:
View attachment 431879
Notice the pulse transitions occur where the audio wave intersects the sawtooth wave. Each pulse represents a sample. Just to make it less confusing (hopefully), here is what the pulses look like by themselves:

View attachment 431882
So what happens when there is no input? In the next pic, I turned the volume knob all the way down so to speak and plotted zero input on top of the saw:

View attachment 431884
Now, I'm going to zoom in and plot the resulting pulses that come out of the comparator. Notice that our input of zero is intersecting the saw right in the middle, which makes the pulses have equal width at the top and bottom. Think about the top part of the pulses as ON, and the bottom part as OFF. Since the length of ON time is equal to the length of OFF time, we have essentially encoded zero.

View attachment 431895
So what happens if I inject a + voltage instead of audio? Here you go:

View attachment 431896
Notice that the pulses are extremely narrow at the top because of where the input voltage intersects the saw. Now, I'm going to inject a - voltage...

View attachment 431899
Now the pulses are extremely wide at the top because of where in the input voltage intersects the saw.

Hopefully it will be clear that unlike a DC voltage which is fixed, and audio waveform is changing constantly, so in the case of class D where we compare the audio with a sawtooth wave, the width of the pulses will be changing constantly. This is called pulse width modulation, or PWM for short.

So now what? The pulses are amplified because we need enough voltage and current to drive a speaker. Usually the pulses are amplified with MOSFET devices because they are relatively easy to turn on and off quickly, which is important, because in this case, they would be turning on and off 400,000 times a second. Class D amp efficiency stems from the amplification of a signal that is essentially either on or off. Heating in older amplifier designs comes from transistors essentially operating as variable resistors. The transistors in class D amps are essentially operating as switches.

After the PWM is amplified, it is connected to the speaker output through a passive low pass filter. This filter is very much like a low pass filter found in a speaker cabinet crossover. Here is what the output audio looks like:

View attachment 431902

The tech savy here will notice that this would be a pretty darn powerful amp. We have somewhere around +/-100 volts of signal swing and we started with +/- 5 volts. If you compare this pic with the first, you will notice that it's upside down...more on that later.

I've hit the picture limit with this first post, and I will pick it back up later...

Wow! Looking for the next "installment"!