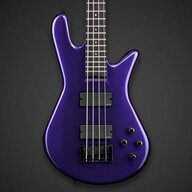
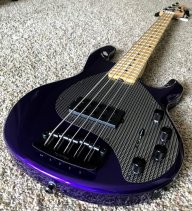
I'm not sure there's been any frequency curve posted on the Specials yet, but there have been a few about previous Stingrays, such as this post here:
Thread 'EQ curves of common bass preamps (Music Man, Seymour Duncan, Warwick) [56K warning]'
[crossposted from seymourduncanforums]
Since I went through the trouble of measuring I can as well post it here.
This is all done with pink noise. I had separate runs with sweeping sine and sweeping square but as expected, these linear distortion units (aka equalizers) don't behave differently for that than for pink noise.
Note that the red line is always the reference pink noise, the original signal.
Preamps in use:
- Seymour Duncan's 3-band bass preamp
- Music Man's bongo 4-band
- Music Man's 3-band as found in a 2000 non-classic stingray
- Music Man's 2-band as found in...
Interestingly, if I'm reading it right, it seems to show the old 3 band Stingray, which is the one you like, having the treble covering a pretty wide range with a very slight peak between 4k and 5k. I would tend to suspect that the Special is maybe focused a little higher than that, but that there's something else causing it to present as more subdued unless really boosted. Maybe more mids or lows inherent in the preamp or coming from the neodymium pickups.


 ) is so veeerry nice.