• TalkBass has been independent since 1998. Add your voice.
    Create a free account to reply to discussions, view embedded media, and browse with fewer display ads.
    Join freeLog in
    Want zero display ads or expanded classifieds tools? Compare plans.

Music Man Stingray 2-Band EQ Frequency Curves

Thundamental

Tone Chaser
Jul 4, 2011
51
43
Los Angeles
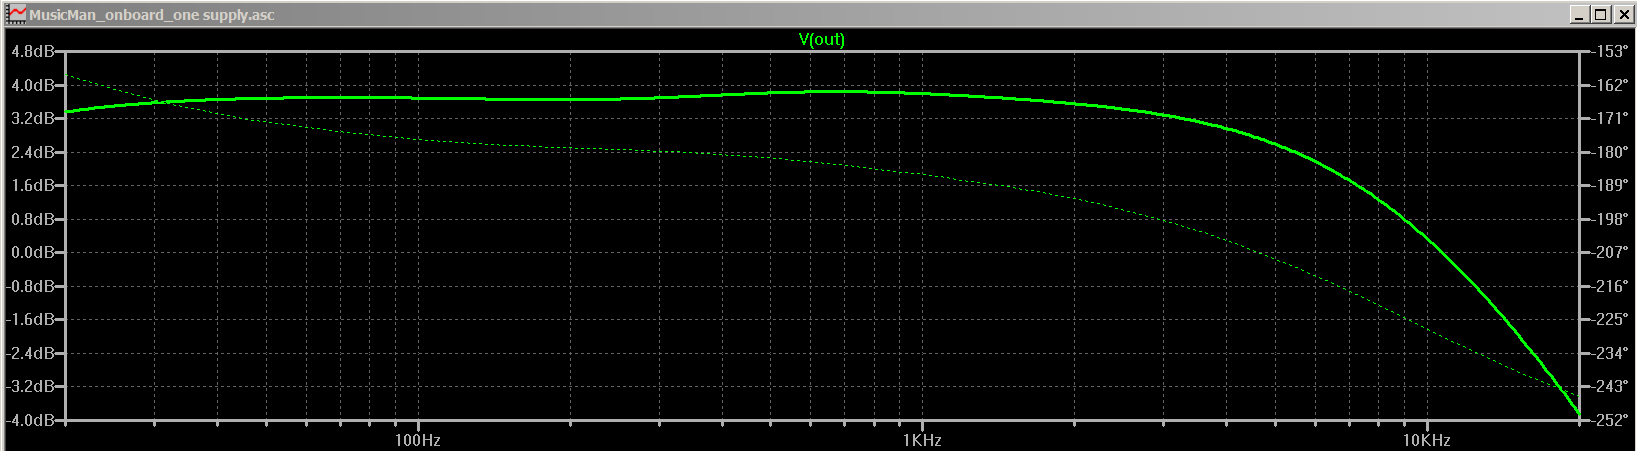
I am creating this post to clear up any any doubts or misinformation on the EBMM 2-band preamp. I found these frequency responses on another forum and realized the info isn't here, but it should be so here it goes... The preamp is not boost only. There is no perfectly "flat setting" but as you can see you CAN get very close. Hope this info helps.

T=5 means Treble Knob about half way.
B=10 means Bass Knob all the way up.
The settings vary in this test from 0-10.

T=0, B=0
MMpre_T01_B01.PNG.png


T=10, B=10
MMpre_T99_B99.PNG.png


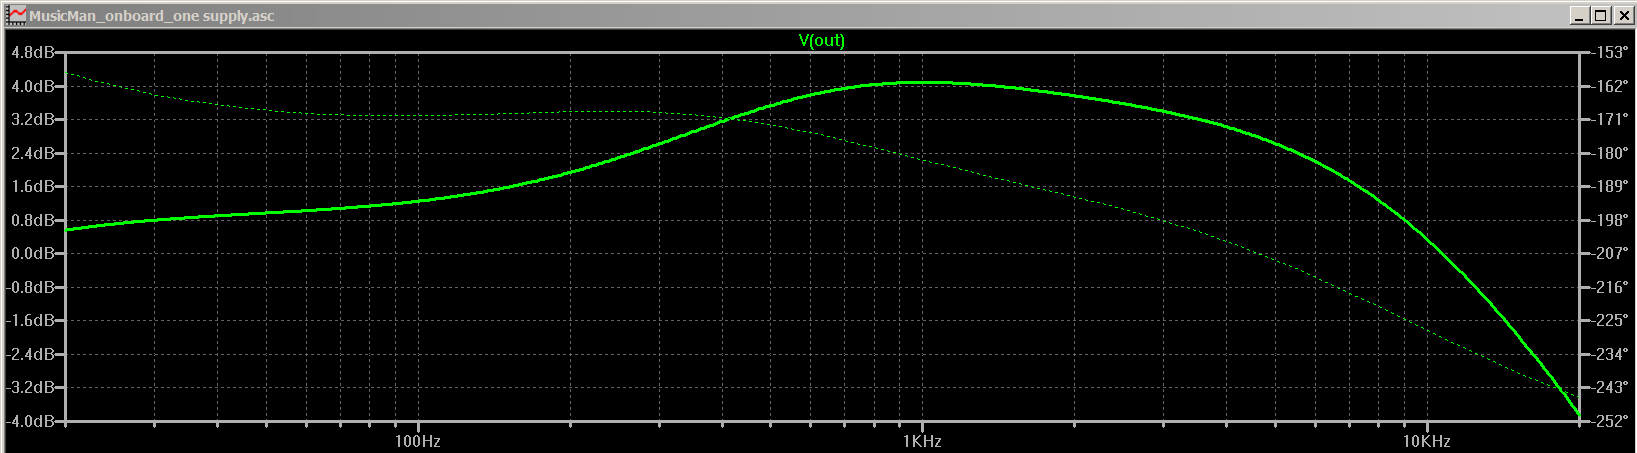
T=4, B=5
MMpre_T4_B5.PNG.png


T=4, B=3
MMpre_T4_B3.PNG.png


T=4, B=7
MMpre_T4_B7.PNG.png


T=10, B=0
MMpre_T99_B01.PNG.png


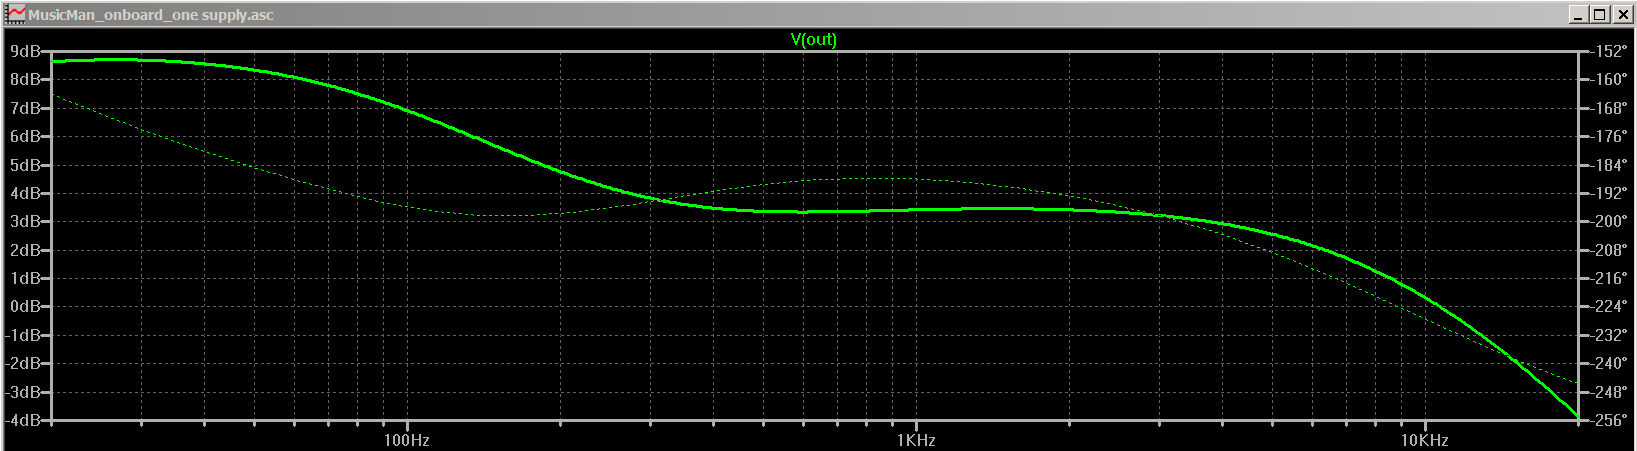
T=0, B=10
MMpre_T01_B99.PNG.png
 
Of course vertcal alignment does not change the shape of the graph. Just in case you want compare the amount of cut/boost between two curves in different graphs you need to vertically align them first. It's just a bit misleading if you only compare the shapes without looking at their vertical values. But maybe I am just mentioning something obvious to anybody else.
 
  • Like
Reactions: manchild
Of course vertcal alignment does not change the shape of the graph. Just in case you want compare the amount of cut/boost between two curves in different graphs you need to vertically align them first. It's just a bit misleading if you only compare the shapes without looking at their vertical values. But maybe I am just mentioning something obvious to anybody else.

Those modeled response curves are not even for the stock MM 2-band config, so all of that is essentially moot anyway. I made them as a very quick and dirty illustration for a DIY builder at DIY audio.com who was contemplating pre-buffering a pair of non-MM pickups and running that signal into a MM preamp. So I made no attempt to pretty things up, since they were never intended for more general consumption. I don't really mind that they were posted here without permission or attribution, but I wouldn't want anyone to be mislead.
Yel_wink.gif


John East actually measured a stock preamp and posted his results on Talkbass and I would recommend just looking for those.
 
Those modeled response curves are not even for the stock MM 2-band config, so all of that is essentially moot anyway. I made them as a very quick and dirty illustration for a DIY builder at DIY audio.com who was contemplating pre-buffering a pair of non-MM pickups and running that signal into a MM preamp. So I made no attempt to pretty things up, since they were never intended for more general consumption. I don't really mind that they were posted here without permission or attribution, but I wouldn't want anyone to be mislead. View attachment 2525698

John East actually measured a stock preamp and posted his results on Talkbass and I would recommend just looking for those.

But presumably (?) the basic takeaway (which seems to be what I hear from my 2-band) is the same, ie
Bass: slight cut to significant boost with 'flat' somewhere close to 0;
Treble: significant cut and boost, with the cut frequency lower than the boost frequency such the cut takes some high mids with it but the boost really only affects the very top.
 
  • Like
Reactions: mcnach
Interesting. Do you have some measurements for 3band eq StingRay ? It would be usefull to get flat response from bass and amp too.

While it may not yield a no-cut, no-boost condition, all the 3-band preamps I've been around have the center detent on the EQ knobs.

It may not be "flat", but it seems like a good starting place. And I leave them on the center detent all the time on my SR5s except to sometimes lower the treble for a less-agressive tone when called for.
 
I know this is an old thread, but I just wanted to mention that I created a "stingray simulator" using the parametric eq in my helix to make any non stringray get the signature 2 band treble plus partial scoop that is so popular and useful when recording. That's something you can't get without a ray, specially so the treble, but with the right boost getting close to 10k plus some cut in lower mids and an optional boost in the low bass plus a bass rolloff down low, I got close enough to solve my immediate need without owning an actual ray. It's not the same, but it's pretty good.

Thanks for the frequency response plots in this thread.
 
I know this is an old thread, but I just wanted to mention that I created a "stingray simulator" using the parametric eq in my helix to make any non stringray get the signature 2 band treble plus partial scoop that is so popular and useful when recording. That's something you can't get without a ray, specially so the treble, but with the right boost getting close to 10k plus some cut in lower mids and an optional boost in the low bass plus a bass rolloff down low, I got close enough to solve my immediate need without owning an actual ray. It's not the same, but it's pretty good.

Thanks for the frequency response plots in this thread.

Would you mind sharing your settings for this? I've been trying do this on my helix but it never ends up sounding quite right.
 
I also apologize for reviving this old thread another time, but it was recently linked to in another current thread. :angel:

The preamp is not boost only
If you look at the curves, it is Boost Only.
At no point does the curve drop below the "flat" levels. In the places where it appears to dip, the dB scale has been shifted upwards.

For example:
- at T0/B0 @ 30Hz is at -2dB. (the first frequency tick in the low end to the right of the Y axis)
- at T10/B0 @ 30Hz is still -2dB. Nothing in the bass was cut.

Similarly:
- at T0/B0 @ 2KHz, it's at about -6dB
- at T0/B10 @ 2KHz, it's also at about -6dB.

And:
- At T0/B0 @ 400Hz, it's at 0dB
- At T10/B10 @ 400Hz, it's up to 2dB even though it looks like it's in the middle of the scoop.

The only spot i see a potential for the tiniest amount of reduced level is at 1KHz. At flat it's at or just below -2dB, and with the bass up it's at or just above -3dB. But it's hard to tell because the scale of the dB axis changed slightly. And the cut would be less than 1dB.

Also, we can't say T0/B0 isn't flat without knowing how this test was done. I would read that graph as T0/B0 is flat eq, meaning no change to the incoming signal, and the graph we see is the frequency response curve of the signal from the pickup unchanged by the pre. But without asking whoever did the initial test if they were getting their signal from the pickup or in isolation, we don't really know.

-----

And for anyone struggling with trying to adjust their EQs to approximate the Stingray curve, a tip:
You don't want your EQ settings to match these graphs. You want to adjust your EQ so the resultant output signal after the EQ matches these graphs.

So to try to replicate this, you need to know the frequency response curve of your bass to know which way you need to adjust your EQ bands, so that when you take a frequency response curve after the EQ it looks like the graph you're trying to replicate.
 
Last edited:
  • Like
Reactions: DrummerwStrings